[#15] Evaluating SaaS companies
How SaaS businesses differ from traditional businesses; and some key metrics for evaluation
Hey! Welcome to Marginal Futility. This blog is my attempt to summarize and share some interesting things I come across, especially related to business, finance and tech. I have previously written about the power law in venture capital, business lessons from Amazon and common errors in estimating market size. You can find the full archive here.
You can subscribe below if you wish to receive updates directly in your mailbox. No spam, ever! :) You can also follow me on Twitter here.
(Disclaimer: All views expressed in this blog are mine; and do not, in any way, represent the views of my employer.)
On to today’s article…
The idea for this post came a few weeks back when one of my friends asked for help in evaluating a SaaS business. I realized that a lot of financial analysis metrics used for conventional businesses are not useful, or at least not enough, to evaluate SaaS businesses. This post is an attempt to explain why that’s the case, and give a very basic overview of some of the metrics that can be used. At the end of the post, I have given a list of resources which I found to be useful to understand these concepts in more detail.
…
Understanding Software as a Service [SaaS]
Traditional software companies license software to be administered by the customers on-premise. Typically, the IT department of the customer would handle most of the implementation, infrastructure development, and support.
SaaS, on the other hand, is delivered, managed and accessed remotely from a server. SaaS applications run in the cloud, and do not require users to incur capital expenditure on hardware, networking, or other support infrastructure.
SaaS is one of the three models of cloud computing, the other two being Platform as a Service (PaaS) and Infrastructure as a Service (IaaS).
Here’s a nice infographic giving a rough explanation of how the different approaches work – taking pizza as an example! (Source: David Ng)
…
Indian SaaS landscape
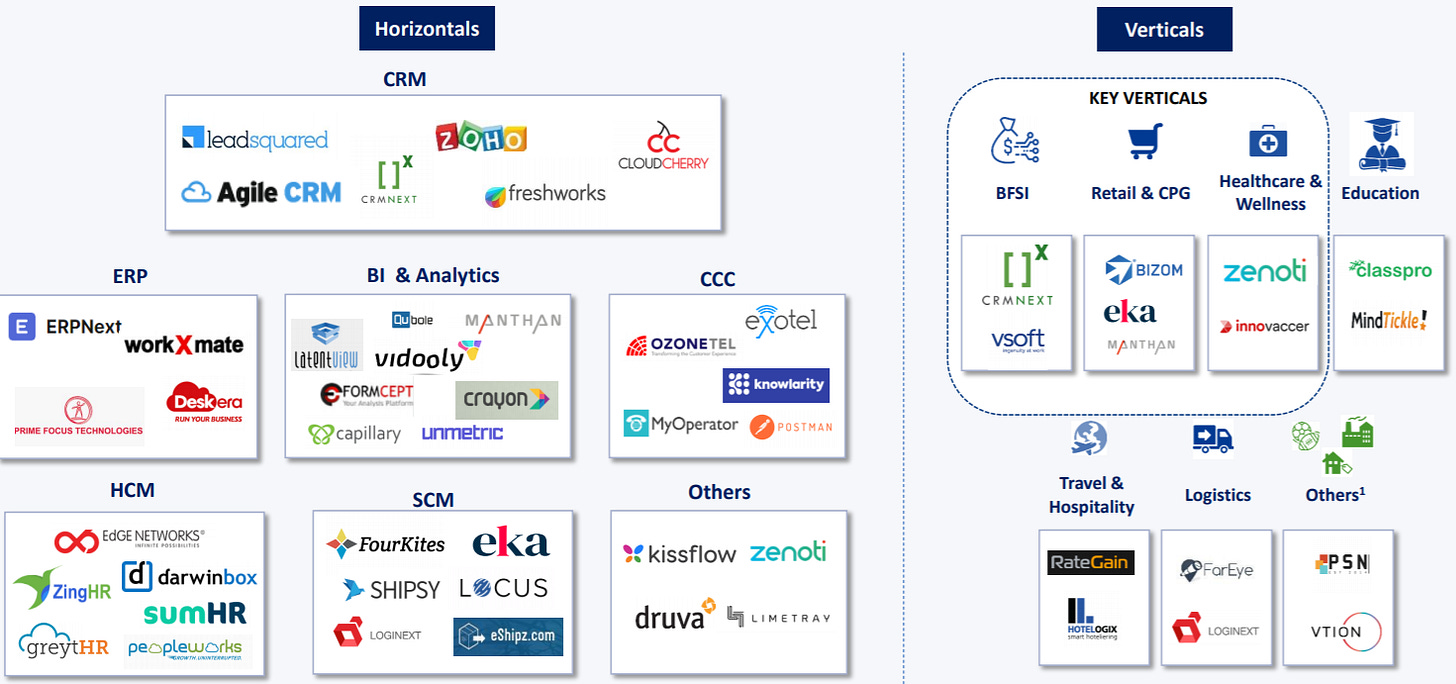
The Indian SaaS ecosystem has witnessed strong traction over the past few years. As per a recent NASSCOM report, Indian pure-play SaaS revenue is expected to grow around ~3.5-4x by 2025.
Here is a list of some key Indian pure-play SaaS companies:
…
Evaluating SaaS businesses requires a different set of metrics
SaaS, being a recurring revenue business, is different from traditional software businesses because the revenue for the service is booked over an extended period of time (the customer lifetime).
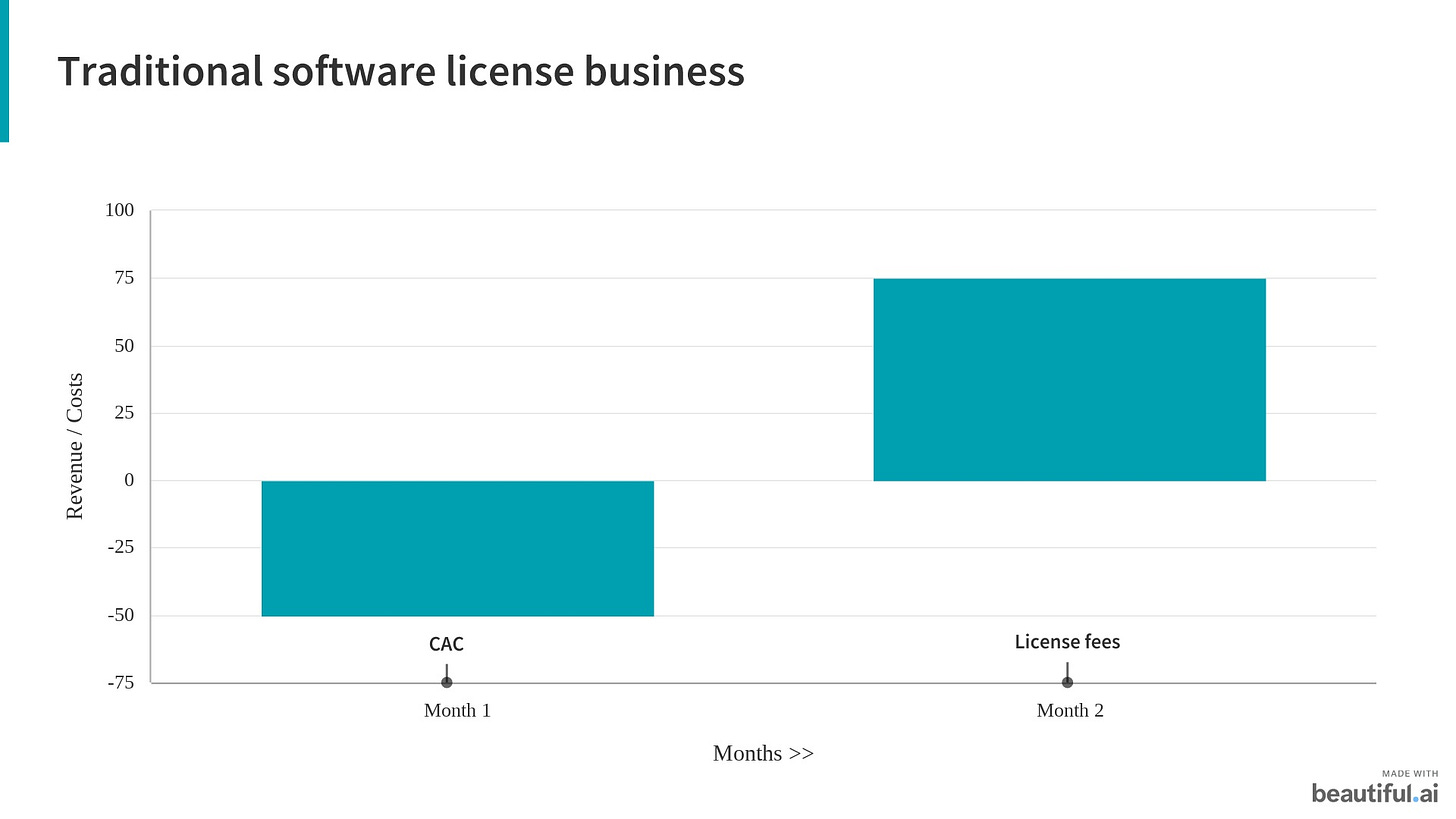
In a traditional software business, companies generally sell a perpetual license to their software and then later sell upgrades. Customers pay for the software license up front and then typically pay a recurring annual maintenance fee (say 10-15% of the original license fee).
This is great from an accounting standpoint: the timing of revenues and costs are perfectly aligned. All of the license fee costs go directly to the revenue line and all of the associated costs get reflected as well, so a $1M license fee sold in the quarter shows up as $1M in revenue in the quarter.
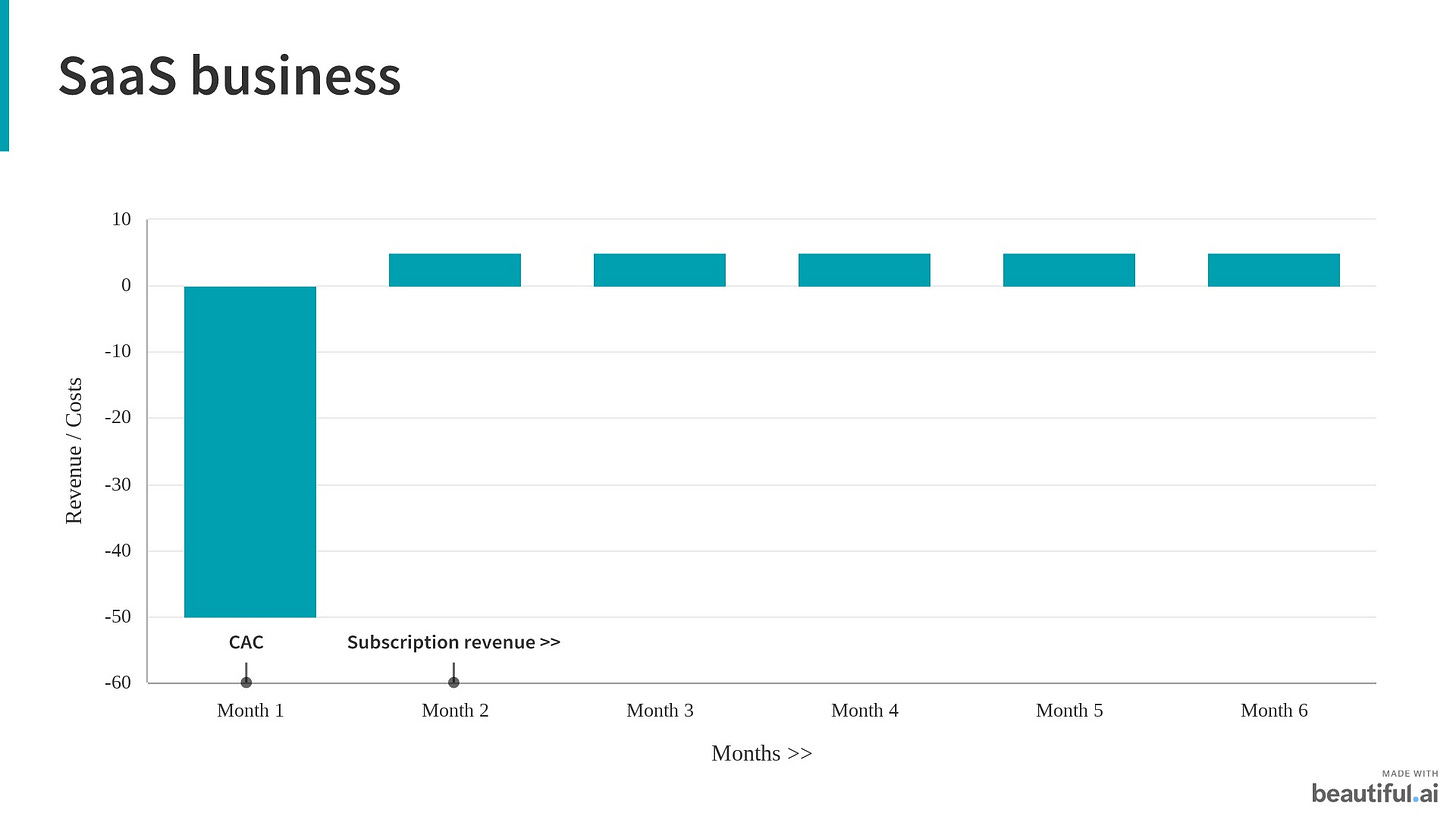
However, compare this to a SaaS business. Instead of selling a perpetual license, the company sells the software through a service model - the customer can pay a monthly / annual fee and use the services on an ongoing basis. even if a customer signs an annual contract, accounting rules dictate that the company can book revenue only as the service is delivered, so in each month, the company can book only 1/12 of the annual contract value. But as far as the costs are concerned (including sales and marketing, hosting infrastructure, cost of maintaining the software etc), all of them have to be booked when incurred. Here’s how it looks like on the income statement:
The income statement alone therefore is not enough to gauge the health of a SaaS business.
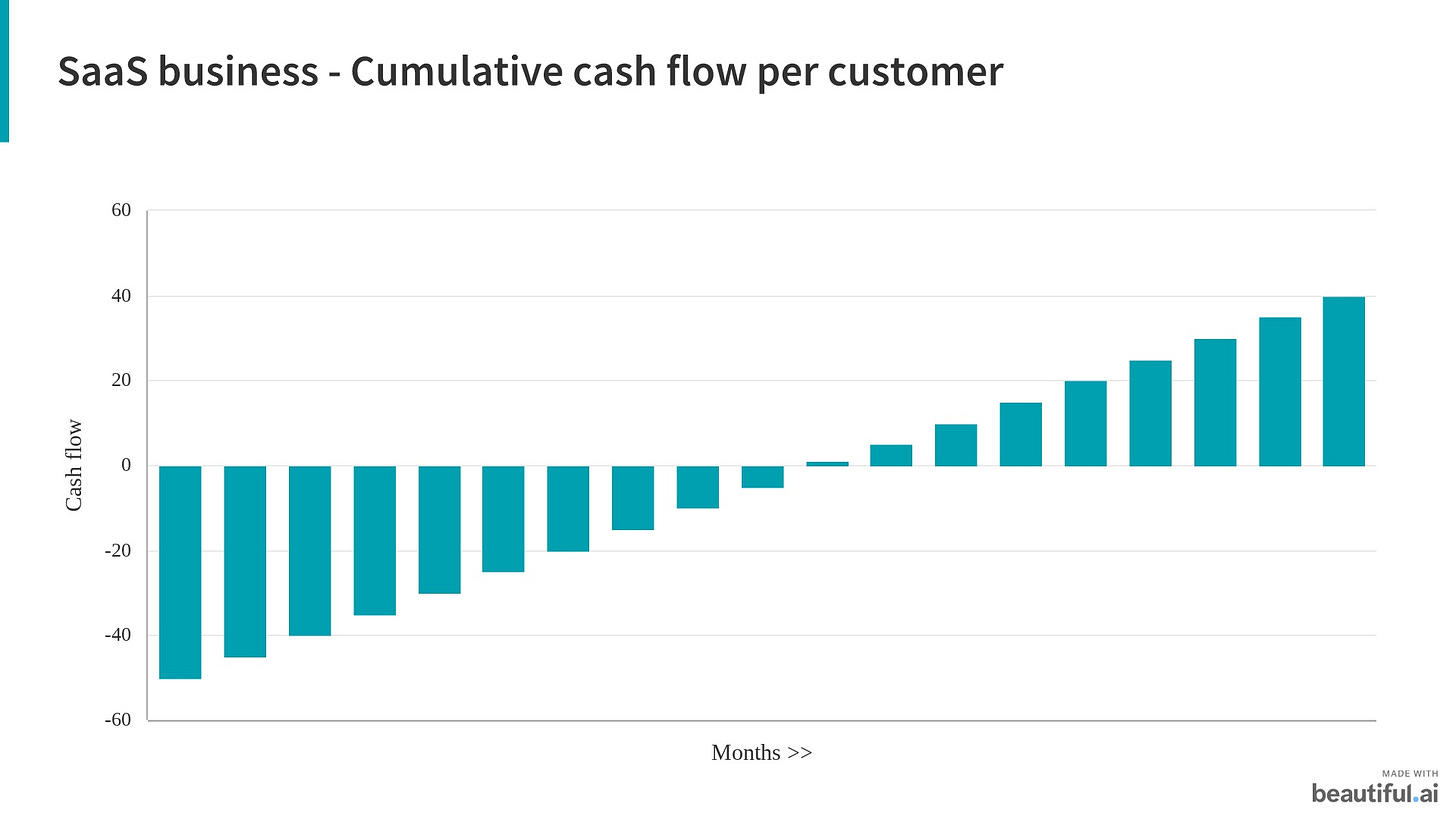
A similar problem of misalignment extends to the cash flows as well - and hence, cash flow statement becomes a lagging and not a leading indicator of the financial health of the business.
The problem accentuates as the company keeps growing - with the cash flow deficit increasing. (This is the reason why SaaS businesses make significant losses in the early part of their growth journey).
…
The importance of unit economics
With income statement and cash flow statement not giving an accurate and full picture, the best way to evaluate a SaaS company is by looking at its unit economics.
The fundamental question to be answered here is: Is the making more from its customers than it is spending on acquiring them?
That is,
Is the lifetime value of customers (LTV) > Cost of acquisition of customers (CAC)?
…
1️⃣ Lifetime Value of Customers
Lifetime value is the present value of the future profit from the customer over the duration of the relationship. It helps determine the long-term value of the customer.
Customer Lifetime Value (LTV) is the average gross margin that a customer generates before they churn (cancel). This is often a forward-looking estimation.
As per Andreessen Horowitz,
LTV = Contribution margin from customer x Avg. lifespan of customer (typically expressed in months)
where,
Revenue per customer (per month)= Average order value multiplied by the number of orders.
Contribution margin per customer (per month)= Revenue from customer minus variable costs associated with a customer. Variable costs include selling, administrative and any operational costs associated with serving the customer.
Avg. life span of customer (in months)= 1 / Monthly churn
Note that the above formula doesn’t take into account time value of money and hence ceases to work properly when you have very long customer lifetimes. The discount rate (which should be the Weighted Avg Cost of Capital of the business) can be incorporated in the formula though to account for time value of money.
…
2️⃣ Churn rate
Churn rate is the rate at which the company is losing customers or revenue through subscription cancellations.
Customer Churn Rate= Customers that churned in period T / Total customers at the start of period T
Lifespan of the customers= 1 / Customer churn rate
It is important to track both monthly and annual customer churn rates: reasonable sounding monthly churn can quickly turn into disastrous annual churn.
An important factor to consider is customers onboarded with some ‘minimum commitment’. A portion of the customer base may be unable to churn for some time (even when they want to), typically because they're still contract-bound (for instance, the company may have offered its customers a monthly rolling contract with a 3 month minimum commitment). Factoring these customers into the churn calculation will under-report the real churn rate, so they should be excluded from calculations:
Hence, the formula now becomes:
Customer churn rate= Customers that churned in period T / (Total customers at the start of period T - Bound customers)
Apart from customer churn, we should also calculate Revenue Churn.
Gross Revenue Churn= Monthly Recurring Revenue (MRR) lost in a given month / MRR at the beginning of the month
Net churn= (MRR lost-MRR from upsells) in a given month / MRR at the beginning of the month.
Why is it important to calculate both customer and revenue churn?
Here’s an explanation from David Skok:
Imagine a scenario where we have 50 small accounts paying us $100 a month, and 50 large accounts paying us $1,000 a month. In total we have 100 customers, and an MRR of $55,000 at the start of the month. Now imagine that we lose 10 of them. Our Customer churn rate is 10%. But if out of the ten churned customers, 9 of them were small accounts, and only one was a large account. We would only have lost $1,900 in MRR. That represents only 3.4% Revenue Churn. So you can see that the two numbers can be quite different. But each is important to understand if we want a complete picture of what is going on in the business.
Note that churn can also be negative (which is obviously a very good sign!) This happens when Expansion revenue from existing customers is more than lost revenue from churning customers.
…
3️⃣ Cohort analysis
Measuring churn isn't enough though: we would ideally want to understand the reason behind the churn, and fix it. In order to do this, the best way is to group together customers with similar attributes such as month joined, or the length of time they've been a customer - these groups are called cohorts. We can then use these cohorts to try and identify the triggers that cause churn and get a good understanding of retention and customer lifetimes.
Below is a typical cohort analysis visualization (Source: ChartMogul)
Cohort analysis gives a more complete picture of how subscriptions evolve over their lifetime.
Instead of looking at an aggregate number like churn rate, a cohort analysis provides a visual representation of how the churn rate evolves over the lifetime of a group of customers who were onboarded in the same time period / month.
This can help answer questions like:
At what point in the lifespan of the subscription is churn the highest?
Is the churn stabilizing after a point in time?
These answers can prove invaluable to a company to reduce its churn: for example, it may focus its customer experience efforts around the duration when churn is highest. On an ongoing basis, the company can see whether its efforts are leading to reduced churn rates.
Ideally a company would want to see the following:
Stabilization of retention in each cohort after a period such as 6 or 12 months. This means the company is retaining its users and building a progressively larger base of recurring users
Newer cohorts performing progressively better than older cohorts. This would be a good indication of the product and its value proposition improving over time
Cohort analysis is a good tool to even measure other metrics - for example, whether the cohorts increase their spend over time.
Zomato recently published its draft prospectus - here’s a look at how Zomato’s cohorts have been performing. The below table shows that customers which placed their first order on Zomato in 2017 are now spending 3x of what they were spending then. The next cohort (of 2018) increased their spending at a faster rate
…
4️⃣ Customer acquisition cost (CAC)
CAC shows how much the company needs to spend to acquire a single new customer. For most SaaS businesses, the costs of acquiring a new customer are determined by two factors:
The costs of generating a lead (usually determined by marketing expenses).
The costs of converting that lead into a customer (usually determined by sales expenses)
The most common way to calculate the cost of securing a single new customer is to bundle together the total sales and marketing expenditure in a given time period, and divide it by the total number of new customers.
CAC= Total customer acquisition cost in Period T / New customers acquired in Period T
Note that if a company generates leads from both paid and unpaid channels (or organically), it is important to calculate acquisition cost separately for each. For instance, if a company acquires 20 customers at $100 CAC while it also acquires 100 "free" customers (with $0 CAC), the average CAC is roughly $17. This blended CAC might be accurate but not very useful.
Hence the formula now becomes:
Paid CAC= Total customer acquisition cost in Period T / New customers acquired in Period T through Paid marketing
…
5️⃣ LTV / CAC
Neither LTV or CAC mean much in isolation: we would need to work out whether the value being generated by customers over their lifetime is sufficiently more than the cost of acquiring those customers.
LTV / CAC ratio is one of the most commonly used metric in evaluating SaaS businesses. It acts as a measure of customer profitability as well as of sales and marketing efficiency.
A good rule of thumb is that LTV / CAC should be atleast 3x, but this would obviously vary depending on the type of business.
Here are some of the ways in which companies can use LTV / CAC ratio:
Determining which set of customers to focus on. All else being equal, the customer set with the higher LTV/CAC deserves more incremental investment. It is also useful to look at customer segments with lower LTV / CAC and identifying potential ways of increasing their profitability
Determining how much to spend on acquiring customers. For instance, let’s say a company wants to determine how much to pay for referrals. If the LTV of customers is $100 and the target LTV:CAC is 3:1, then the value of the referral would be around $30.
Another useful metric to measure is the CAC payback period, that is, how many months does it take to recover the CAC. Even though the LTV/CAC ratio may be healthy, if it takes too long to recover marketing spend, a company may require very high amounts of capital (that is, very high cash burn).
…
I hope the above note gave you a good overview of key metrics to evaluate SaaS businesses. Here are some additional resources which I found helpful:
SaaS Metrics 2.0 by David Swok
SaaS Valuation Primer by Andreessen Horowitz
The Dangerous Seductions of LTV formula by Bill Gurley
Quantitative Approach to Product Market Fit by Tribe Capital
Investment Memos by Bessemer Venture Partners
Free email course on SaaS metrics by ChartMogul
Interesting things I read this week
1. How Big Tech got so big: Hundreds of Acquisitions by Washington Post
They all followed a similar pattern. First, they became dominant in their original business, like e-commerce for Amazon and search for Google. Then they grew tentacles, making acquisitions in new sectors to add revenue streams and outflank competitors.
2. The Surprising Power of the Long Game by Farnam Street
Most people play the short game. Playing the long game offers an advantage. At first the tiny differences are barely noticeable. It’s only when you look back do you see the massive difference in outcomes.
Thank you for reading! Please share it with people who you think might find it interesting :)
You can also follow me on Twitter here.
(Disclaimer: All views expressed in this blog are mine; and do not, in any way, represent the views of my employer.)


Excellent.